Day-to-day swings in temperature are an accepted part of the weather in many areas around the country. However, when 30-year averages of daily temperature fluctuations from thousands of stations around the country indicate a steady change in average temperatures over time, there are tangible implications for agriculture, energy consumption and many other aspects of daily life.
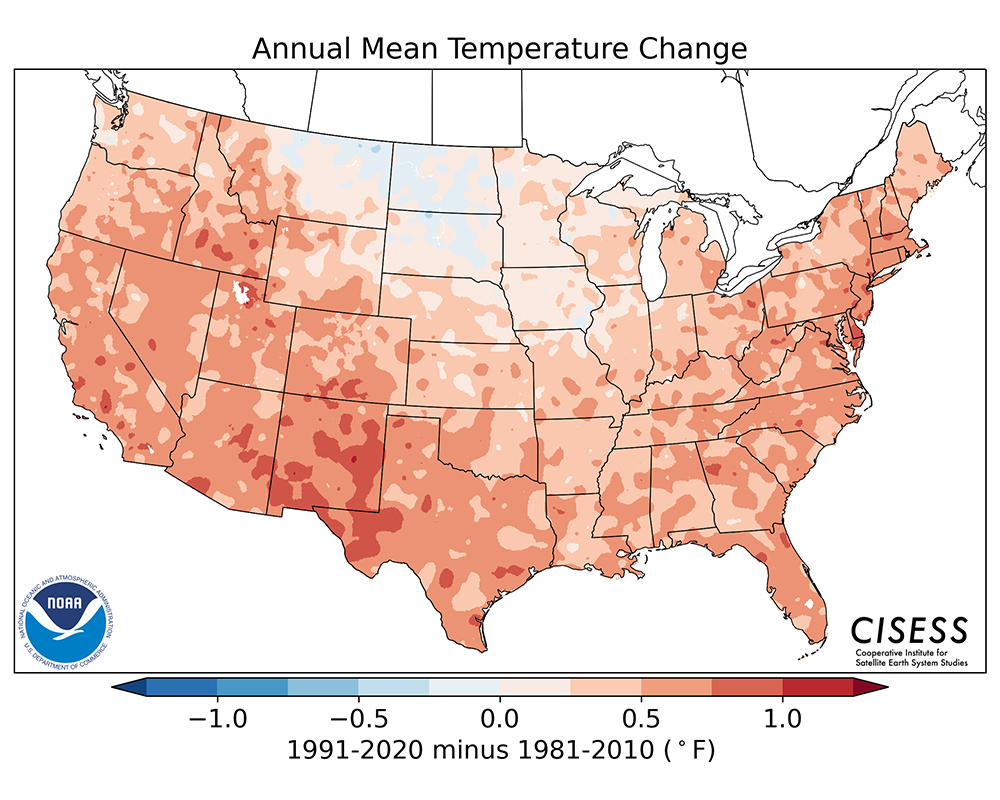
The National Oceanic and Atmospheric Administration (NOAA) released its new 30-year average U.S. Climate Normals for the 1991-2020 period on May 4, and nearly all parts of the country saw average temperatures increase. The only exception was a small area of the north central Great Plains, which saw overall average temperatures drop.
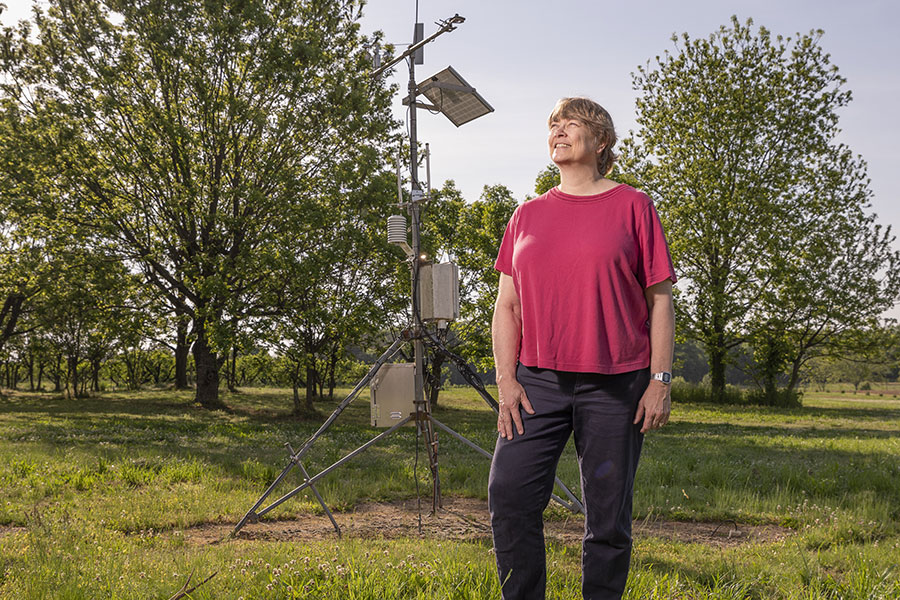
This is not surprising because of the rising temperatures we are seeing in the U.S. as well as the rest of the world, said Pam Knox, agricultural climatologist with University of Georgia Cooperative Extension. Director of the UGA Weather Network, Knox administers the Climate and Agriculture in the Southeast blog for UGA Extension and regularly reports on weather patterns and events that could impact the state’s agricultural producers.
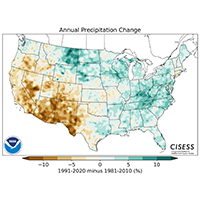
“Due to global warming caused by increasing greenhouse gases in the atmosphere, temperatures here in the Southeast increased by between 0.25 and 0.75 degrees Fahrenheit,” according to the climate normals, Knox said. “The changes in precipitation varied quite a bit across the country. Generally, the West got drier while the East got wetter. Here in the Southeast most areas got wetter, with only a small area of southeastern Georgia that got slightly drier.”
The 30-year normals for temperature, precipitation, degree days and several other variables are updated once every ten years and now cover the period from 1991 to 2020. The previous set of normals was based on data gathered between 1981 and 2010. NOAA National Centers for Environmental Information (NCEI) generates the official U.S. normals every 10 years according to the requirements of the World Meteorological Organization and National Weather Service.
This article from the NCEI describes the process of calculating the normals, which are gathered from observations at approximately 9,800 stations across the U.S. operated by the National Weather Service. An interactive map providing links to individual stations is available from the North Carolina Institute for Climate Studies, which is co-located with the NCEI in Charlotte.
“When you are averaging so many things together and you have a big change, that is really indicative of the problem,” said Knox. “When you think about weather, a change of 10 degrees from day to day is a short-term variation and may not seem like a big deal. (NCEI) is averaging the daily weather data at thousands of stations every year.”
By averaging data from stations in so many different areas, the data reduces errors caused by individual stations or localized temperature anomalies.
“Urban heat islands, like the one in Atlanta, are really a very small part of the total average. You can’t blame the overall increases in temperature on that. The majority of these stations are not in cities, they are in places like Brooklet, Georgia,” said Knox, referring to the southeast Georgia town of about 1,395 where one of the NCEI stations is located.
While the changes in overall average temperature may not be readily detectable, the changes have a cumulative impact on many economically important areas, she added.
“In some respects, it is not going to affect people on a daily basis, but it does affect the cost of energy, the kind of crops we grow, what it does to the ecosystem and what can survive — all things that are economically really important. It is changing and getting warmer decade by decade, and all of the things scientists have been saying about a warming climate are really coming true.”
As an example, peach trees in Georgia require a certain number of cooling hours over the winter to produce a good crop each year. When temperatures warm over a long time period, the gradual change can affect crop yields and producer revenues. If yields decrease significantly, producers may have to change the varieties they are planting, something that can cost thousands of dollars and influence market availability of certain crops.
“If you have to put a new tree in the ground, there are a lot of economic costs that go along with that. It can also make a big difference in food prices and in the livelihoods of farmers growing the food,” Knox said. “A lot of people are divorced from the process of what farmers have to do to get food to their tables.”
More information on the new climate normals is available on the NCEI website. Information on the UGA Weather Network can be found at weather.uga.edu.

